White paper
How to Set Your Marketing Budget and How to Spend It
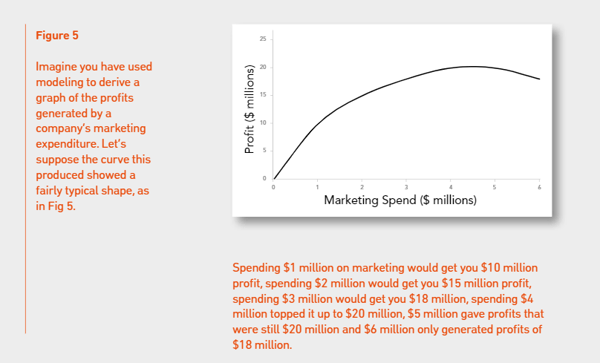
In order to improve marketing effectiveness, it is important for marketers to decide how much marketing money to spend and where best to allocate that spend to get the best return. The problem seems simple but there is much confusion about the best solution.


The problem
One of the most valuable calculations a marketer can make is to decide how much marketing money to spend and where best to allocate that spend to get the best return. Rather like stock market investors, marketers make their living by placing their bets.
Improving marketing effectiveness revolves around improving the ability to place those bets at the right time, in the right place. The problem seems simple but there is much confusion about the best solution.
The wrong approach
If we look at a few of the methods many marketers use, we can quite quickly see their limitations. For example, marketing budgets are often set as a fixed percentage of sales; but why should, say, 10 percent of sales revenue be the right figure? Marketing’s job is to cause sales, not reflect them. This approach has the causality the wrong way around.

Another popular approach is to set marketing budgets with reference to competitors’ spending, perhaps looking at the ratio of SOM to SOV (the share of market to share of voice). This will not work in general because matching competitors, even relative to your market share, will not necessarily find the optimal spend level. What matters is simply the marginal profit you get for marginal spend. Even if you are spending twice as much as the competition, the only point to watch is whether that spending is profitable for you. It is irrelevant how competitors’ products react to marketing spend. The other main approach is to set the budget by looking at all the things one would like to do and then negotiate with the Board to get as close to that figure as possible. The problem here is that there is no link to the outcome, there is simply a list of “investments” without the corresponding calculation of the “returns”.
The right approach - use cause and effect

The amazing insights from response curves
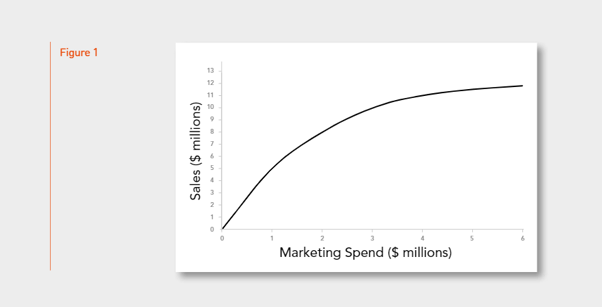
The chart below (Fig. 1) shows a response curve. It tells you that, in a given period of time, spending $1 million would get you $5 million in sales, while spending $2 million would get you $8 million, and spending $3 million would get you $10 million.
Once you have a response curve, you can start to project forward and forecast, with some certainty, what will happen under various different sets of circumstances. Different scenarios can be combined so that you can start to look at what would happen if you spent $5 million on TV and $2 million on radio while cutting the price of the product by 10 percent at the same time. Or you can focus on optimization and making the most of your spend. You can get an algorithm to analyze the response curves for you and tell you where the optimal points are on those curves.
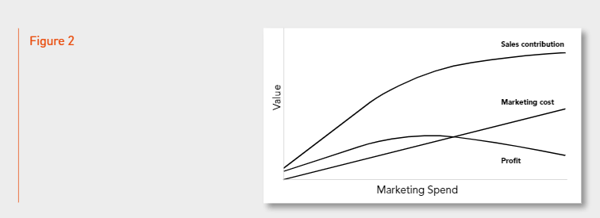
We can begin to see how this might work by considering three curves. In Figure 2 below we have a sales response curve which shows money spent on the horizontal axis and sales value less cost of goods on the vertical axis. We can also plot a cost line on the graph, which would carry on rising steadily with extra marketing spend. If you then plotted another line, a profit curve, you would see that it went up, reached a maximum, and then started to turn down again.
Now it becomes quite straightforward to identify the optimal spend point. It is simply the topmost point of the profit curve. Curves like these can be used to decide how to allocate spending over time. In the example above, it becomes clear that there is definitely a level of spend that would be too much for any given week. A budget would need to be spread out to avoid saturation. Analysis such as this can show how one can optimize the impact and effectiveness of this spending over the period in question.
So if, for example, you are a marketer who has been given a budget of $10 million to be spent over a period of three months, the optimizers will tell you how best to do that - optimizing across all your different response curves and all your different marketing activities, products, channels, and countries, etc. The aim is to use the insights given by the response curves to move money around between these different dimensions to achieve the best possible effect. The graph below (Fig. 3) shows a simple example of two curves (for radio and online) and illustrates why it is a good idea to move money around to get the optimal outcome.
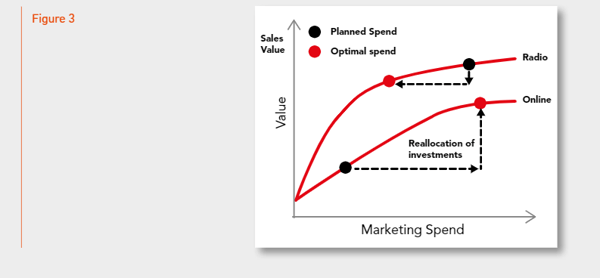
What we can clearly see here is that taking money from radio, where the curve is getting flatter, and spending more on the online activity will increase overall sales. You gain more sales than you lose by making this switch. We would normally look at profit rather than sales but this simple example illustrates the idea. This is the whole basis of optimization. The aim is to ensure that you spend your money where it generates the best return. Alternatively, you can reverse the question and calculate how much you need to spend to hit a given sales target.
Determining the optimal budget level
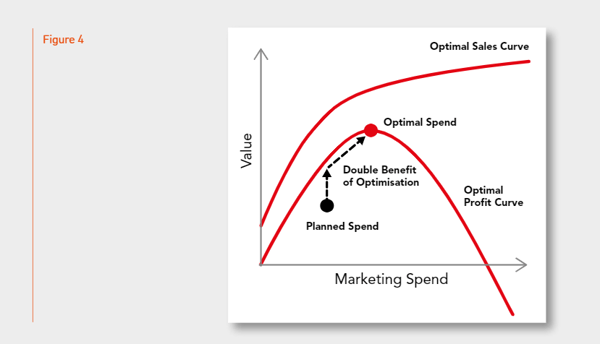
The curves below (Fig. 4) show the optimal sales and optimal profit curve for different total marketing budgets. We can see that by spending more money, more effectively, one can gain a double benefit. The first benefit is the gain that’s achieved just by spending the original budget in a more effective way. The second comes from spending more money, again in an effective way.
This is very typical. In our experience from over 20 years of looking at this type of analysis, most companies are on the left-hand side of the profit curve. Which means they are actually underspending. What we mean when we talk about ‘underspending’ is that these companies are failing to maximize the opportunities open to them because they don’t have sufficient budget or spend it optimally.
Economic theory says that you should spend and keep on spending right up to the point where your profit is at its maximum. Unfortunately as one moves up the curve, return on investment will diminish. The benefits of each additional unit of spending start to reduce. A naïve analysis would lead someone to conclude that they should stop investing but this is not correct. Even though the marginal profit gets smaller and smaller as you approach the top of the curve, it is still profit. And so should be captured by spending more money. Let’s see how this works with some actual numbers, as shown in the chart below.
If we calculate the return on investment, as we spend more we see a 10 to 1 return on the first $1 million invested. When the spend rises to $2 million it drops to a return of 7.5 to 1. The next million, taking the spend up to $3 million, only brings in another $3 million profit and the overall average rate of return falls to 6 to 1.
If this led someone to stop investing then it would mean missing out on the opportunity to raise profits from $18 million to $20 million, in a largely risk-free way, simply by investing another $1 million. By accepting that diminishing returns on investment are inevitable but carrying on spending to the top of the profit curve, a company will make the most of the opportunities presented to it.
Taking the average rate of return on investment as the way to evaluate how resources should be allocated across a firm is simply not correct. The difference between average and marginal return on investment is crucial. It is easy to calculate average ROIs but unfortunately, they are highly misleading for decision making and resource allocation.
What you should be worried about is the marginal return on investment. What you want to be clear about is whether you can make more profit by spending more. If you can, and the rate of return on that new, marginal slice of investment money makes sense, then you should go ahead and spend it. It all depends on where you’ve got to on the response curve. Where the slope of the curve is steep, you can keep spending money and you’ll get a very good payback.
Conclusion
Obviously, if funds are scarce in a firm, and generally they are, it is possible that spending that million on another project, such as a new supply chain process, may yield a greater marginal return. That would be a good reason for not investing that last million in marketing.
But we all know that isn’t the real reason for marketing’s underspending. The real reason is that few marketers actually have the numbers that would lead to a rational decision. Modeling provides the analysis for making these marketing decisions and optimizing resource allocation. For obvious reasons, the profit curve is one of the most popular outputs from the modeling toolkit.

But other useful curves can be charted, using the same kind of approach. A price/demand curve, for example, can be produced, with price along the horizontal axis and volume sold on the vertical axis. This gives you a steep downward curve, with sales volumes understandably declining as price increases. It allows marketers and product managers to figure out what the optimal price for a product would be and plot the different levels of profit that can potentially be generated at different price points.
All these response curves have stories to tell. Once you see what shapes they take on - informed by the vast amounts of historic time series data that have generated them - you can tell a great deal about how you should act to achieve your business objectives.
For marketers, modeling is a game changer. It makes all this and more possible. What we’ve done at ScanmarQED is make it easy and affordable. And this means, for instance, that you can readily produce response curves for individual campaigns and advertising executions as often as you like. Without necessarily changing anything else about the way we do business, we can use modeling to make marketing more cost-effective, to avoid waste, to save millions, and to make millions.
If you are interested in downloading this white paper for future use, click here.
At ScanmarQED, we’re constantly striving to help you in getting actionable insights that allow you to make smarter marketing decisions. If you have any questions related to your marketing budget, please contact us. Click the button below and we’ll be happy to give you a tailored demo of our marketing mix modeling software: